Porphyry
2025
Simple graphical tools to understand the relationship between porphyry composition, hydrothermal alteration, mineralogy and copper-gold grades in porphyry copper deposits
Ross R. Large


Porphyry copper models A) pencil porphyry intrusions from a source batholith (Sillitoe, 2010), B) Typical alteration zonation around calc-alkaline porphyry copper deposits (Holliday and Cooke, 2007)
There are a multitude of porphyry Cu-Au models, that are tending toward the same processes and end products. Sillitoe (2010) is probably the best available description. Here we are dealing with alteration types, mineralogy and zonation around a porphyry intrusion, and how these types are easily and rapidly identified for practical use in porphyry exploration. Scott Halley has pioneered the use of multielement geochemistry in the study of igneous host rocks and their alteration in a range of ore deposit types. His website, especially his tutorials (https://www.scotthalley.com.au/tutorials) are well worth a visit and I strongly recommend it for those who are approaching this type of exploration geochemistry for the first time. I have learnt a lot from Scott, but have given his approach a different emphasis.
My aim at the outset has been to develop a diagram like the alteration box-plot for VHMS deposits, that would enable geologists to identify alteration types in Porphyry copper deposits. I have worked on this for the past five years and have settled on a graphical plot that seems to do the job for most porphyry Cu-Au deposits; called the PCD alteration diagram. I published the results in Ore Geology Reviews (2025): “Simple graphical tools to understand the relationship between porphyry composition, hydrothermal alteration, mineralogy and copper-gold grades in porphyry copper deposits”.
I must emphasis, that to get the best value from this approach you preferably need a drill hole database with at least ten holes with multielement geochemistry through all alteration zones and mineralisation. Complete drill hole geochemistry down-hole at 1 or 2 m intervals is best. However, if you are starting a drilling campaign and only have one hole, that will have to do.
I started my research by using the alteration box plot (designed for VHMS). Although this diagram cannot unravel the complexities of porphyry Cu-Au alteration, it does have the ability to resolve, in most cases, the composition of the mineralising porphyry intrusion (Large, 2025 provides the details). The Na/Al vs K/Al plot used extensively by Scott Halley provides important information on alteration assemblages, but cannot resolve some key overlaps, like propylitic and advanced argillic alteration. The final solution was to include Ca in one of the axes enabling propylitic and advance argillic to be separated, leading to the PCD alteration diagram.
Ross to write and supply this piece.
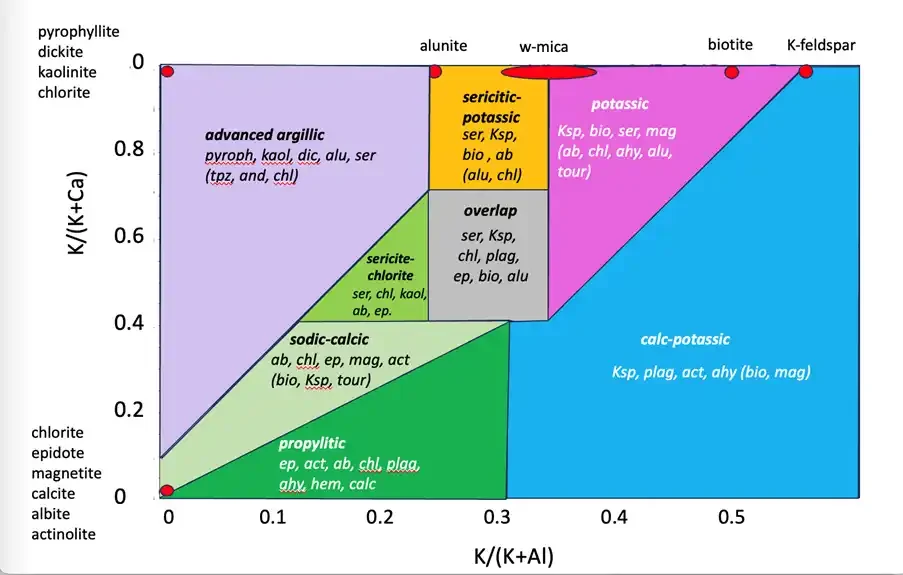
The horizontal axis (K/(K+Al) enables the separation of alteration minerals with different K/Al ratios; (pyrophyllite, dickite, kaolinite) and alunite which are diagnostic of advanced argillic alteration, white-mica diagnostic of sercitic (or phyllic) alteration and biotite, K-feldspar which are diagnostic of potassic alteration. The vertical axis (K/(K+Ca) enables the separation of advanced argillic alteration minerals without Ca (pyrophyllite, dickite, kaolinite), from propylitic alteration minerals with Ca (epidote, calcite, actinolite, plagioclase, anhydrite). Some important alteration minerals are left floating, including quartz, chlorite, magnetite, hematite and pyrite.
Many geologists who are critical of this diagram have asked how we defined the areas and boundaries of the alteration fields. There have been several processes involved; 1) The positions of the node minerals is most critical. For example, if a rock contains significant pyrophyllite (> 20%) it must plot near the pyrophyllite node which designates the advanced argillic field, or if contains >20% K-feldspar it must plot near to the K-feldspar node which designates the potassic field, or >20% epidote it must plot near to the epidote node which designates the propylitic field etc, this process defines the areas of the fields but not their boundaries. The boundaries were selected by trial and error, using a large database of porphyry alteration samples that had previously been classified and published from other porphyry studies. These samples were plotted and most probable boundaries between designated samples selected. This process was supported by conversion of whole-rock geochemistry to mineral percentages in several porphyry databases using the MINSQ computer program and plotting alteration mineral percentage on the PCD diagram (Large et al, 2025). In time it is likely that an AI based diagram will be produced with more precise boundaries.
In reality fixed boundaries between fields are unrealistic unless we all accept compositional ranges, for all alteration minerals, in each alteration field. For example, what is the defined range for K-feldspar or biotite in the potassic field, is it > 5%, > 10%, >20%, or > 40% etc? As far as I am aware such mineral proportions for each alteration type have never been defined or accepted.
Ross to write and supply this piece.
Ross to write and supply this piece.
Workflow for PCD Alteration: WF1: Peschanka PCD Interpretation in ioGAS.
Ross to provide details.
Ross to provide details
Workflow # 4. for PCD Alteration: Dataset CS4 Bellas Gate Jamaica. Interpretation in ioGAS.